Star Plots


A star plot is a graphical data analysis technique for examining the relative behavior of all variables in a multivariate data set. The plot I found is of oil peaks. I found it here http://www.humble-inc.com/rof_pic4.gif

Correlation matrix


A Correlation matrix describes correlation among M variables. It is a square symmetrical MxM matrix with the (ij)th element equal to the correlation coefficient r_ij between the (i)th and the (j)th variable. The matrix I found is in reference to lifestock genetics. I found it here http://www.livestockgenomics.csiro.au/Genome_to_Phenome/matrix_corr_gt1SD.png

Similarity matrix


A similarity matrix is a matrix of scores which express the similarity between two data points. The matrix I found shows gene sequencing. I found it at http://www.clcbio.com/scienceimages/sm/smith-waterman-optimal-local-alignment.png

Stem and leaf plot


A stem and leaf plot is a display that organizes data to show its shape and distribution. The plot I found shows ages of people at a famil reunion. I found it here http://www.eduplace.com/math/mhm/5/06a/ts_5_6a_wi-1.gif

Box Plot


A boxplot (also known as a box-and-whisker diagram or plot) is a convenient way of graphically depicting groups of numerical data through their five number summaries. The smallest observation, lower quartile (Q1), median (Q2), upper quartile (Q3), and largest observation. Q1, Q2, and Q3 form boxes, and the smallest and largest observations form whiskers. The one I found shows annual snow depth at Mathsville Ski Resort. I found it here http://edubuzz.org/blogs/nbhs3x1/files/2007/01/boxplot-2.JPG

Histogram


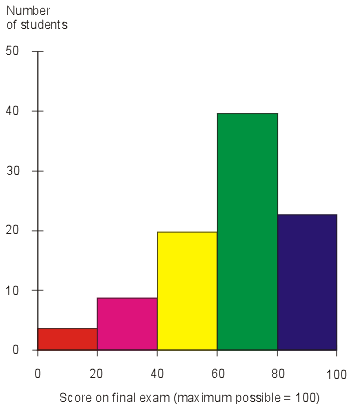
A histogram is a graphical display of tabulated frequencies, shown as bars. The graph I found shows a number of students and what they recieved on the final exam. Man, I hope I can be in the blue bar!! I found it here http://media.techtarget.com/digitalguide/images/Misc/iw_histogram.gif

Parallel coordinate graph


A parallel coordinate graph is used to plot large multivariate datasets. Each variable in the data plot is represented as its own Y Axis on the graph. A maximum point for each Y axis is selected, and they are scaled relatively to each other so that each variable takes up the same area in the graph space. The one I found shows baseball statistics. I found it here http://www.matthewtavares.com/baseball_report/graph_allteams.bmp

Triangular Plot


A triangular plot is a graph of 3 variables. It is most often used in geologic studies to show the relative compositions of soils and rocks, but it can be more generally applied to any system of three variables. The plot I found shows Liberal, Conservative, and Labour vote percentages for 2004. I found it here http://ex-parrot.com/~chris/images/20050407/triangle.png

Windrose


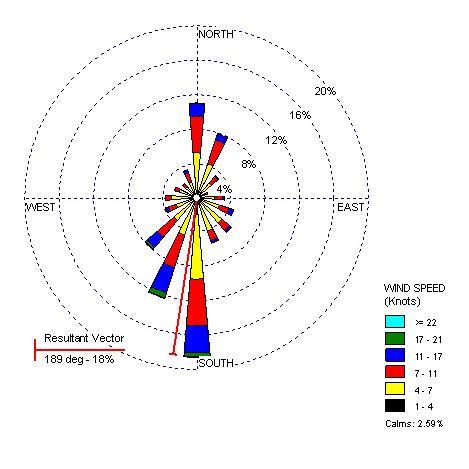
A wind rose is a graphic tool used by meteorologists to give a succinct view of how wind speed and direction are typically distributed at a particular location. It is given in circular form. The one I found is for Washington State. I found it at http://www.climate.washington.edu/windrose/Seattle-WindRose.jpg

Climograph


A climograph is a graphical depiction of the monthly precipitation and temperature conditions for a selected place. Precipitation is shown by the bar graph. A line graph depicts temperature. The one I found is for Memphis, Tenn. I found it here http://www.uwsp.edu/geo/faculty/ritter/images/atmosphere/climate/climographs/memphis.jpg

Population Profile


A population profile is a chart showing the number of people as a function of their ages. The graph I found shows the projected population structure with and without the AIDS epidemic for Botswana for 2020. I found it here http://www.fao.org/docrep/005/y8331e/y8331e02.jpg

Scatterplot


A scatterplot is a summary of a set of two variables, usually drawn before working out a linear correlation coefficient or fitting a regression line. It gives a good visual picture of the relationship between the two variables. The scatterplot I found shows a wifes age in reference to her husbands age. I found it here http://cnx.org/content/m10949/latest/age_scatterplot.gif

Index Value Plot


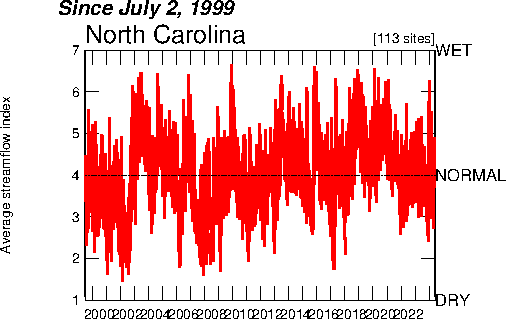
An index value plot shows a variable's range within an index rather than at a specific point. The graph I found shows the water variables in North Carolina since 1999. I found the graph here http://water.usgs.gov/waterwatch/regplots/real/real_nc_2.gif

Accumulative line graph or Lorenz curve


Accumulative line graph or Lorenz curve is a graphical representation of the cumulative distribution function of a probability distribution. The graph I found shows the two variables as being "cumulative percent of income" and "cumulative percent of population" and shows the perfect equality reference line, related to the area of inequality. I found this graph here http://www.unc.edu/depts/econ/byrns_web/Art/Glossary/LorenzCurve.jpg

Bilateral Graph


A bilateral graph depicts two different variables. It shows increase on one side of a zero line, and decreases on the other. The map I found shows growth in bilateral humanitarian assistance in the years of 2005-2006 for various countries in the World. I found the graph here http://www.globalhumanitarianassistance.org/New%20Images/Growth%20in%20bilateral%20humanitarian%20assistance%202005-2006%20copy.jpg

Nominal area choropleth map


A Nominal Area Choropleth Map uses nominal data to display the information desired. They usually show quantitative differences. The map I found showed the electoral vote predictions for 2008. I found it here http://politicalmaps.org/wp-content/uploads/2008/05/electoral-map-prediction-05222008.gif

Unstandardized choropleth maps


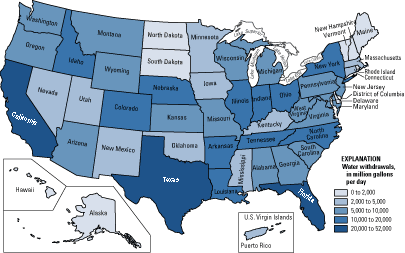
Unstandardized choropleth maps use no order in their ranking, they use raw numbers. The map I found shows the amount of water withdrawls in million gallons per day for every state. I found this map here http://pubs.usgs.gov/fs/2005/3051/images/2000choropleth.gif

Standardized choropleth maps


Standardized choropleth maps show only asingle data set, but it is standardized to allow comparison. The map I found showed the percentage of population under 14 years of age in Canada. I found it at http://www.statcan.gc.ca/pub/92f0138m/2008003/figures/figure3.1-en.jpg

Univariate choropleth map


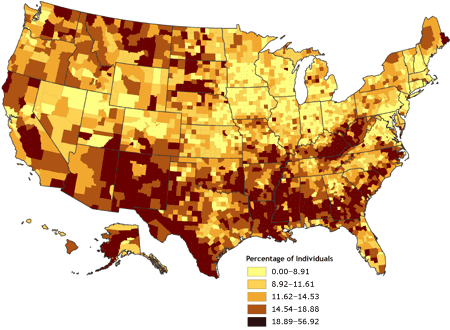
A univariate choropleth map always just displays a single set of date. The map I found shows percentage of individuals in the United States. I found this map here http://www.cdc.gov/pcd/issues/2007/oct/images/07_0091_02.gif

Bivariate choropleth maps


A bivariate choropleth map displays two variables on a single map by combining two different sets of graphic symbols or colors. It usually illustrates the relationship between the two. The map I found (very outof focus) displays the land use, life expectancy, and GNP per capita in Africa in 1989. I found it here http://image24.webshots.com/25/3/32/3/286333203FPiEKt_fs.jpg

Unclassed choropleth maps


Unclassed choropleth maps assign shadings proportional to the data values so that these choropleth maps do not have to classify the data. The map I found shows the acres of vegetables harvested for sale in 2002 for every county in the United States. It has a scale to go along with it. I found the map here http://www.nass.usda.gov/research/atlas02/Crops/Vegetables%20and%20Melons%20Harvested/Vegetables,%20Acres%20Harvested%20for%20Sale-choropleth%20map.gif

Classed choropleth maps


A classed choropleth map determines height and shading or color intensity of the bar for each map classed. This would involve creating a classed frequency legend including a frequency histogram, a frequency curve, and shading. The map I found shows males to every 100 females, data taken from the 2000 census. Looks like Alaska needs a few more girls!! I found this map at http://my.ilstu.edu/~jrcarter/Geo204/Choro/map-AmFact-6eqint-orange-80pct.jpg

Range graded proportional circle map


A range graded proportional circle map is a proportional circle that depicts the circles in relation to ranges of data. The map I found shows the Mexican population in the western United States. I found this map here http://www.neiu.edu/~jrthomas/377/circle.jpg

Continuously variable proportional circle map


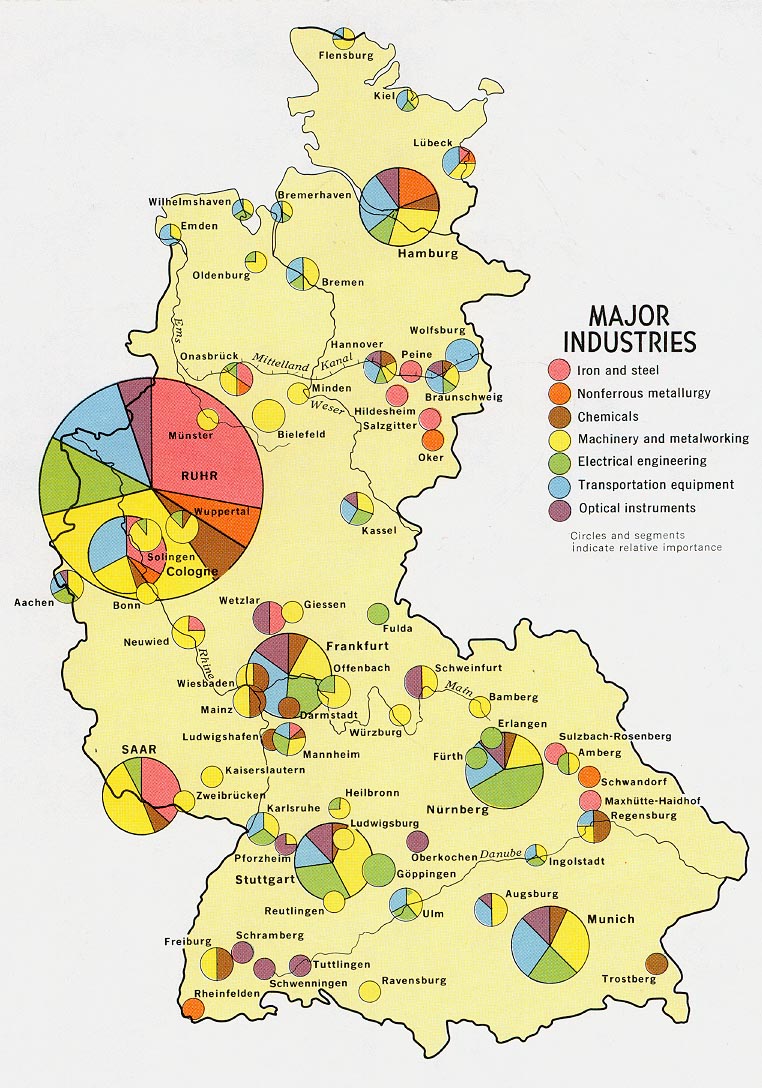
A continuously variable proportional circle map is a proportional circle map which utilizes circles to create point data. The map I found shows themajor industries for given cities in Germany. I found this map at http://www.lib.utexas.edu/maps/europe/west_germany_ind_1972.jpg

DOQQ


DOQQ's (Digital Orthoimagery Quarter Quadrangles) are computer-generated images of an aerial photograph in which the image displacement caused by terrain relief and camera tilt has been removed. The one I found was taken of Washington D.C.. I found it here http://seamless.usgs.gov/website/seamless/products/1mdoqq.jpg

DEM


DEM's (Digital Elevation Models) are a digital representation of ground surface topography or terrain. This map shows Lake Tahoe in Nevada. I found it every interesting because it shows the mountain ridges around the lake, but you can very clearly see where the lake is!! I found it here http://tahoe.usgs.gov/images/4ds/dem_zoom.jpg

DLG


DLG's (Digital Line Graphs) are digital vector representations of cartographic information derived from USGS maps andrelated sources. This map shows the Atlantic Seaboard. I found this map at http://www.versamap.com/Hatteras_Grv.png

DRG


DRG's (digital raster graphics) are scanned mages of U.S. Geological Survey topographic maps. This map shows the Colorado River running through Texas. One thing I found interesting was the Texas State School for the Deaf, right next to the river on the southwest side. I found this map here http://www.tceq.state.tx.us/assets/public/gis/images/drg.gif

Isopleths


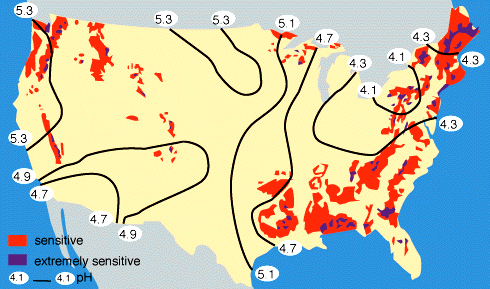
Isopleths are contour lines on a map representing any given variable that maintains a constant value. This map shows the regions of sensitivity to acid rain in the United States. I found this map here http://www.globalchange.umich.edu/globalchange1/current/lectures/kling/water_nitro/USAacid_rain2.gif

Isopachs


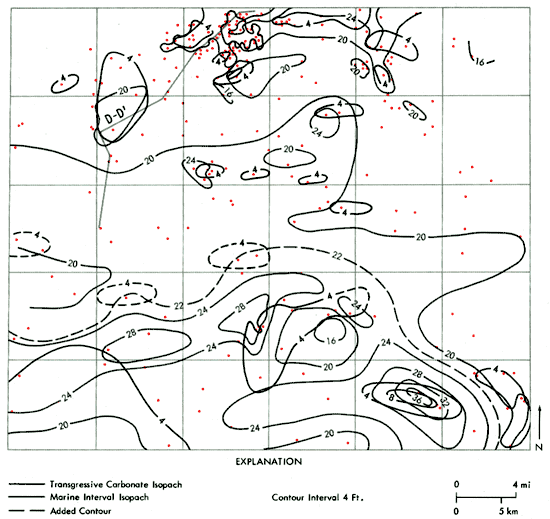
Isopachs are contour lines on a map connecting points of thickness, usually rock. This map shows the thickness of rock in Kansas City. I found this map here http://www.kgs.ku.edu/Publications/Bulletins/220/gifs/fig51.gif

Isohyets


Isohyets are lines drawn on a map connecting points of equal rainfall. This map shows the amount of rainfall in Hong Kong in millimeters from August 1-4, 2006. I found this map at http://www.weather.gov.hk/informtc/prapiroon/prapiroon_rf.gif

Isotachs


Isotachs are lines on a given surface connecting points of equal wind speed. This map showswind speed given in knots for the southeast United States, notice how windy it is around the Tampa, FL, and Cinncinatti, OH, areas! I found this map at http://weather.cod.edu/help/700tach.gif

Isobars


Isobars are lines drawn on a map connecting equal atmospheric pressure. Thismap shows lines of isobars around an area of low pressure over top of the Great Lakes in the United States and Canada. I found this map at http://www.newmediastudio.org/DataDiscovery/Hurr_ED_Center/Hurr_Structure_Energetics/Closed_Isobars/Closed_Isobars_fig02.jpg

LIDAR


LIDAR (Light Detection and Ranging) is a remote sensing system used to collect topographic data. It is being used by NOAA and NASA to show topographic changes along the coastline. This map shows a LIDAR map after a landslide in Daly City, California in January 2007. I found this map at http://soundwaves.usgs.gov/2007/06/LidarExampleLG.jpg

Doppler Radar


Doppler Radar is something that I find useful in everyday life. I am deathly afraid of thunderstorms and tornados (having been in a tornado when I was 12), so anytime the sky looks even hintingly dark, I turn on the National Weather Center doppler radar. Doppler radar shows the amount of precipitation in any given area. It is also used to predict tornados and hail using the circulation of rain and cloud coverage. This map shows a very bad thunderstorm in Texas in 1997, that actually produced numerous tornados. I found this map at http://www.srh.noaa.gov/images/lub/events/2007/20070417_hailandtornadoes/radar_srm_slaton.jpg

Black and White Aerial Photo


Black and White Aerial photos are normally used for personal or reference purposes. This photo shows Liverpool, UK in 1941, from 1800 feet and I found it being shown for cultural remembrance purposes at http://www.culture24.org.uk/asset_arena/5/55/15555/v0_master.jpg

Infrared Aerial Photo


Infrared aerial photographs are often used to view land surface featues. This shows the northeast portion of the Tetlin National Wildlife Refuge in Alaska showing the allignment of sand dunes. I found this map at http://geology.usgs.gov/connections/fws/images/projects/co-infrared_tetlin_refuge.jpg

Cartographic Animations


Cartographic Animations show changes chronologically over time. This map shows the flooding in Rocky Mount, NC in 1999 following a big rain storm. I found this map at https://www.e-education.psu.edu/files/geog860/image/rmount_streets50.gif

Statistical Map


Statistical maps show data that is variable in different areas and has a key to distinguish those statistics. This map shows the change in crime in Denver, CO, from 2001 to 2002. I found this map at http://www.denvergov.org/Portals/335/images/SOPA_oth02.jpg

Cartogram Map


A cartogram map is when some variable is substituted for land size. This map shows the world in reference to population. As you can see China and India have more population than other countries, so they appear larger. Take a look at the size of Indonesia compared to Australia, weird! I found this map at http://strangemaps.files.wordpress.com/2007/03/population1024x512.png

Flow Map


Flow maps conbine information and have less clutter than most maps. They also show the movement of things over a given time. This map shows the city of Madison, Wisconsin, and their average weekday traffic volume. I found this map at http://www.cityofmadison.com/trafficEngineering/documents/Flowmaps/00_Fmap_Tsht_web.jpg

Isoline Map


Isoline maps are a two-dimensional map representing a three-dimensional model. They have continuous lines joining points of the same value. This map shows the elevation of New York state. I found this map at http://www.regentsprep.org/Regents/earthsci/graphics/102A_9-10.gif

Proportional Circle Map


Proportional Circle maps display data in relation to the siz of circles. This map shows the American Indian population in the states out west in the United States. I found this map at http://www.neiu.edu/~nerobert/Circle%20Map.jpg

Choropleth Map


Choropleth maps are maps that are shaded or patterned in proportion to the measurement variable being displayed. This map shows domestic freshwater use in the United States in 1990 by millions of gallons used per day... Florida's not looking so great... I found this map here http://water.usgs.gov/watuse/graphics/domap.st2.color.gif

Dot Distribution Maps


The dot distribution map portrays quantitative data as a dot. They are very useful in portraying populations, like seen in this map of the United States in 2000. I found this map here http://www.census.gov/geo/www/mapGallery/images/small2kden.jpg

Propaganda Maps


Propaganda maps are used to skew the opinions of their readers into believing whatever the creater is trying to portray. This map was published in Germany in 1934 to create fear of Czech bombing. I found this map at http://strangemaps.files.wordpress.com/2006/12/threat.jpg

Hypsometric Map


A hypsometric map is a map that depicts the configurations of land. This map is an antique map of the United States showing elevation by shading. I found this map at https://www.rare-maps.com/maps_pic/JOC-1896-HYPSO.jpg

PLSS Map


A PLSS map is a PublicLand Survey System that subdivides and describes land in the United States. This map shows a portion of Minnesota's PLSS Map, as you can see the state of Minnesota is marked off into sections and townships. I found this map at http://www.fairview-industries.com/standardmodule/mn-exmp2.gif

Cadastral Map


A cadastral map is a comprehensive register of the land bounds of a county. It usually includes ownership and dimensions of land. This one I found is of counties in Delaware. I found this map at http://www.dalisproject.org/images/cadastral_map.jpg

Thematic Map


Thematic maps are made to reflect a particular theme about a geographic area. This map represents the Land Reserves in Hawaii and who owns the land. I found this map at http://www.creativemappingsolutions.com/maps/thematic/thematic_map_1-web.jpg