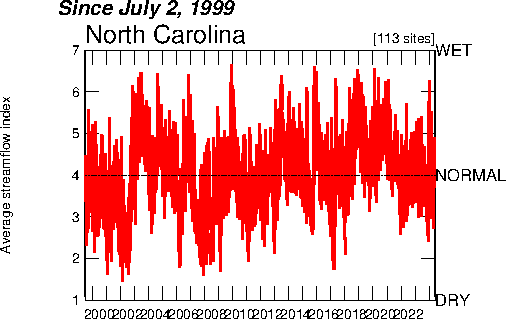
An index value plot shows a variable's range within an index rather than at a specific point. The graph I found shows the water variables in North Carolina since 1999. I found the graph here http://water.usgs.gov/waterwatch/regplots/real/real_nc_2.gif
No comments:
Post a Comment